Investment Considerations: unlearning some of the “truisms”
At its most basic, a truism is a statement that is self evident and contains no new information. The Australian financial services industry has become replete with such truisms which are treated as investment fundamentals and facts. Chief amongst these are “what matters is time in the market, not timing the market” and the related “markets always go on to reach new highs”. Perhaps it is due to the growth of the Australian “investor class” through the long period of unbroken economic growth and accompanied wealth effect throughout society. Or perhaps it is our compulsory superannuation contributions system which has drawn many less financially knowledgeable Australians to seek financial advice.
Presenting “investment fundamentals” as fact provides superficial security to a novice investor, thus increasing the reputation of the advice provider. Consequently, the advice provider benefits from increased business (whether fees or sales commission or bonuses or whatever).
Important investment decisions flow directly from these “investment fundamentals”, some with associated jargon, such as “buy on the dips”, or outright investment strategies such as Dollar Cost Averaging. If markets “always go on to new highs”, why on earth would you not put more money into the market, if you have it, and “buy on the dips”? And of course timing the market is not so critical if you are assured the markets will keep going up “on to new highs”.
In many ways these truisms can be considered punchy marketing messages which simplify much more complex issues to feed the financial services industry that seeks to “clip the ticket” as investors’ funds flow through the system. All is fine while the market “behaves” but problems arise for advice providers who use these truisms as a crutch when markets do not behave, and there are plenty of instances of that even in modern times.
The most recent dramatic example of markets not behaving was the Global Financial Crisis (GFC) which I will discuss below. However it is important to note that, while this was a global event, similarly dramatic events have occurred on other large markets over recent decades. For example, the Japanese stockmarket as measured by the Nikkei 225 index reached a peak of over 38,000 in late 1989 but has not been above 20,000 since the year 2000 and it traded below 10,000 in the aftermath of the GFC (Yahoo.com). The market value of the American NASDAQ composite index of mostly technology companies peaked at over 5,000 in 2000 but fell dramatically to a level just above 1,000 during 2001 and has yet to better its 2000 peak. Even the broader American stockmarket, as measured by the S&P500, had not traded above the level reached in January 2000 until the last 18 months (except for a very brief period before the GFC struck).
Of course the most infamous stockmarket crash was in 1929 where the S&P500 had lost over 80% of its value by 1934 (Shiller 2000). In the 20 years after the 1929 peak the average real return (i.e. inflation-adjusted) of the market was a measly 0.4%. And it was not until 1958, 29 years after the peak, that the market finally achieved a new inflation-adjusted high meaning that an investor that bought $1000 of shares at the peak actually got the same dollar value back from their investment!
Clearly “buying on the dips” would have destroyed a great deal of wealth and caused financial hardship for many investors during these events. It is instructive to consider that shares purchased at 50% of their peak value still decline by 80% in value when those shares decrease by 90% from their peak value (as occurred to some American companies after the 1929 peak and some Japanese and American technology stocks after their respective peaks). What is more, in the aforementioned episodes, those who liquidated stock holdings in favour of cash early in the episode lost significantly less wealth than those that stayed in the market, even if they remained in cash for an extended period.
That is not to say the one should abstain from buying stocks during corrections or even crashes. Sometimes they do represent opportunities to buy good companies at much cheaper prices than was possible a short period earlier. It is simply pointing out that there are very significant risks to doing so. Sure, because of the compounding affect of inflation on the purchasing power of money, stockmarkets will almost certainly go on to achieve new highs. But the simple truth is that nobody can know when those new highs will be reached, and in periods of extreme market dislocation, it is possible the damage from the crash will result in significant damage to the real economy especially if there are missteps in the policy response by Governments. Most importantly, what really matters is what happens to the purchasing power of your money between those peaks as this is the real measure of your wealth – what you can do with it.
Inherent within this discussion is the clear inference that markets are capable of behaving irrationally, either exuberantly or pessimistically, often the latter following not far behind the former. This is what I consider to be one of the greatest flaws to the very common investment strategy referred to as dollar cost averaging (DCA).
In its simplest form DCA is a method to allocate a sum of money towards an investment strategy by periodically allocating equal amounts almost mechanically and without regard to the state of the market(s). Proponents suggest that its mechanical and automatic nature are its strengths; that it disciplines the investor to not over-allocate during periods of exuberance and under-allocate during periods of pessimism. It deals with the uncertainty by providing a rigid format which must be followed with certainty.
The short comings of DCA have been known and openly discussed in financial services industry for several decades (see Costandtinides 1979). Immediate investment of a lump sum has been shown empirically to produce superior investment returns to DCA over extended periods (Williams and Bacon 1993). Consequently those who support DCA in academic literature generally do so with modifications to the strategy and in specific circumstances (Richardson and Bagamery 2011, Dunham and Friesen 2012).
It is regrettable that DCA is still commonly recommended to many Australian investors without qualification.
Interestingly the main reason why investing a lump sum produced a superior result to DCA in these studies is that the markets studied have generally moved up over the study period, so quite expectedly the earlier funds were invested in the superior performing asset class the better the performance. And that has been the general experience of western stock markets over the last half of the 21st century.
Where problems arise is when there are significant long lasting market corrections or crashes occur after all or a majority of capital has been allocated. It’s clear that the timing of markets events relative to the lifecycle of the investment portfolio, which itself is dependent on the life stage of the investor, will have a significant impact on portfolio returns and longevity in retirement.
Let’s take the example of a couple who in 2002 wished to retire in 5 years, who had limited superannuation balances, but, having recently paid off their mortgage, were in the position to contribute significant sums of money towards retirement savings. Given their limited superannuation balances they chose to invest in a very high risk portfolio with all funds allocated to a managed fund which tracked the All Ordinaries index perfectly after fees and on a dollar for dollar basis (so that when the index was at 3,000 the price of one unit was $3,000). To make the example very dramatic, to emphasise the point, the retirement date was October 2007, the market peak before the GFC (Figure 1). In those 5 years they contributed $3,000 each month to their portfolio.
Figure 1. The monthly close for the All Ordinaries Index (Yahoo.com)
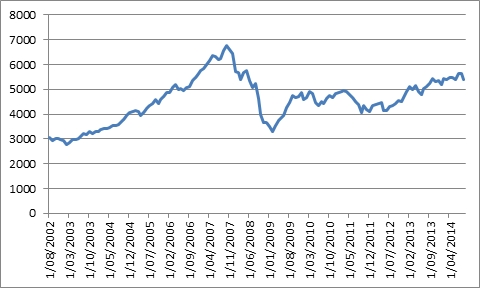
The advantage of DCA is purportedly to discipline the investor to continue investing capital equitably regardless of whether markets are moving upwards or downwards. The period during which this couple were able to save and invest most of their capital towards their retirement corresponded to a very strong period in the Australian stockmarket. In October 2002 their $3,000 contribution purchased one unit in the managed fund but by September 2007 it purchased less than half a unit. Even so, the run up in the stockmarket meant that their $180,000 cumulative investment in the managed fund had grown to $305,734 at retirement.
Most regrettably for this couple, however, they felt that they needed to keep taking the same level of market risk in the hope of prolonging their funds during the draw down phase of their savings in retirement. If they were able to not drawn on their savings, the loss of value experienced in the Australian stockmarket after October 2007 meant that their portfolio had lost over 50% of its value and was $148,688 at February 2009. Even now, almost 7 years to the day since the couple retired, their portfolio’s value would be 20% less than at retirement, if it had been possible to not drawn down on the savings.
This is indeed a dramatic hypothetical example but it does lay bare a major shortcoming of any automatic savings plan which has no reference to the state of the market. And while the dates are intentionally chosen to obtain the worst result possible, for some Australians this would resemble in some ways their own experience for it was common after the GFC to hear or read about people who had delayed retirement to rebuild savings. For one moment just imagine what it must have been like for a Japanese person who retired in the late 1980s just before their market and general economy collapsed, and where property prices have also decreased by over 50% over the same period (see the Economist interactive global house price infographics at http://www.economist.com/blogs/dailychart/2011/11/global-house-prices).
Of course most retirees will need to draw down on their savings in retirement irrespective of what the market does. In fact Government regulations over some pensions have minimum withdrawal limits. From the previous example it is clear that the interaction of market cycles with the portfolio cycle (accumulation and drawn down phases) will also have a major effect on portfolio longevity. If significant amounts of capital are withdrawn during a downturn, and not replenished, then there is less capital in the portfolio on which future earnings can compound.
There is a growing amount of research on this issue for various western markets. Doren et al (2012) comprehensively studied this issue with an Australian perspective. They analysed market data from 1900 to 2009 to determine how the timing of a single share market shock affected the longevity of portfolios that spanned a 75 year period (i.e. as if the investor began accumulating at 25 years of age and lived to be 100). From these data they followed the fortunes of 10,000 hypothetical portfolios. The share market shock was chosen to be a yearly decline of 21.6%, the poorest one year return from the Australian stock market in the data set. The most important assumptions were that 1) there was just one shock, 2) that the portfolio allocation remained the same over the 75 year period and was weighted 70% to shares, 20% to fixed interest and 10% to cash (so what is considered a balanced portfolio), and 3) equal sums of capital were withdrawn yearly in the draw down phase.
The authors found that the years immediately before and after retirement are the most susceptible to market shock and this supported the findings of other researchers working on data from other countries. In fact, this period is commonly referred to as the “retirement risk zone”.
Following is their graph showing how the timing of the single share market fall affected the longevity of portfolios. The Y (vertical) axis shows the percentage of portfolios that have reached a balance of zero, while the X axis is the year in which the share market fall occurs. Retirement is represented at 40 on the X axis as the portfolio has been in existence for 40 years at a retirement age of 65. The lines represent the age of the superannuant.
Figure 2. Longevity risk of portfolios subjected to a single share market shock (From Doren 2012)

As can be observed, if the shock occurred a year either side of retirement the probability of the portfolio not lasting beyond the superannuants’ 85 birthday was around 50%. In fact there is almost a one in four chance that it would not even last until age 75. Interestingly, the risk to portfolio longevity is greater in the lead up to retirement than afterwards with shocks at 15-20 years before retirement having a similar effect on portfolio longevity as if the shock occurred just 5 years after retirement (as is demonstrated on the purple Age 85 line).
What all of this represents is the higher level of risk involved in mechanically following an investment strategy that does not take any account of market behaviour.
The reality, however, for many typical Australian investors is that retirement savings will not come about in a lump sum, such as by windfall or inheritance, but by developing a regular savings plan which must be augmented with an investment strategy to maximise the returns from those savings at retirement. Modified DCA strategies, which take account of market behaviour, such as past year movements, but still are mechanical and involve no decision making by the investor, have been empirically shown to produce superior results to simple dollar cost averaging (Richardson and Bagamery 2011, Dunham and Friesen 2012). These strategies should be strongly considered over traditional DCA.
It is equally important to consider the state of markets when investing a lump sum which may be received as a part of redundancy package or some other source. Clearly a lump sum invested in Australian share market at October 2007 would have fared worse than if it had been invested periodically over the following months.
There is no easy way for an investor to know whether markets are overvalued or undervalued and whether markets are likely to fall or rise and over what time frames. Clearly this uncertainty is what makes markets – many, many people taking opposing positions. Of course, many billions of dollars are spent each and every year employing the brightest minds and the best computing technology to answer that one question. That there are people who have consistently and significantly outperformed the broader market over long periods of time shows that it is possible to generate significant amounts of wealth from investing.
I highly recommend the reader to the writings of Prof Robert Shiller, the American economist famous for introducing the term “Irrational Exuberance” into common market parlance after choosing that as the title of his book which was published in 2000 just prior to the NASDAQ peaked. Prof Shiller subsequently released a revised edition in 2005 just prior to the peak in the US house price bubble. In both editions he provided thorough analyses to show that these respective markets had become irrationally exuberant.
I draw particular attention to his Figure 1.3 in Shiller (2000) which shows an inverse relationship between the PE ratio (P=price = market value of all companies making up the market: E=earnings = average annual earnings of those companies from the previous 10 years) for the American stockmarket at any given time with subsequent 10 year returns. In other words, when the stockmarket was expensive (people were optimistic and thus were prepared to pay more for shares relative to their earnings) the performance of the sharemarket was inferior over the following 10 years than when the stockmarket was less expensive. Moreover, generally the more expensive was the market (the more optimistic the investors), the worse were the subsequent returns, and vice versa.
Shiller’s method of determining whether the stockmarket is expensive or cheap is a very worthwhile tool to the investor. I also recommend reading the quarterly reports from Jeremy Grantham at www.gmo.com who is another well regarded analyst (fund manager) and “bubble spotter” who generously publishes his views and analysis free of charge on the GMO website.
The earlier discussion also highlights the investment risk ramps up considerably for investors in the years preceding and immediately following retirement. It is perhaps understandable that some investors approaching or early in retirement may perceive the need to maintain a high weighting towards riskier growth assets in the hope of securing a higher standard of living in retirement. However, it should be done with the full understanding that the risks are higher than at the earlier stages of their life, and the end result may well turn out to be the opposite of what was intended.
After reading through these analyses it might surprise the reader that between November 2007 and 2009 I reallocated virtually all of my family’s retirement savings from cash and fixed interest to equities (shares), allocating most to equities as the market approached about half the level it was at the peak. I did so even though I understood that there was a risk that our retirement savings would be reduced very significantly if the market continued to fall as it did after the 1929 peak in the American stock market or the 1989 peak in the Japanese stock market.
As it turned out our portfolio reached maximum allocation to shares only a few weeks before stock markets bottomed. But I did not know at the time where would be the bottom. I fully understood the risks and I still invested because I was under 40 years of age and I had confidence in my ability to place my family’s finances on a good footing. (I honestly cannot tell you what I would have done if I was 20 or even 10 years older.) I also believed that Governments, and especially global central bankers, understood the risks that the global economy faced and that they would be able to rescue the situation. When such investing luminaries as Warren Buffett and George Soros state that the global economy was at the brink of total collapse, it is difficult to overstate the risks that were posed to the savings and aspirations of us all.
The market rebound has seen my family’s portfolio increase nicely. But with policy missteps by Governments and central bankers, all of our experience from 2009 onwards could have been so different. And as you will read in Appendix 2, the global economy is far from out of the woods just yet.
Life is inherently uncertain and so too is investing. Many consider that to live a bland life so as to avoid taking risk defeats the purpose of living. In life we all accept a certain amount of risk – the level of which we each are comfortable taking being variable and very much an individual decision – to obtain various rewards which collectively amount to what we refer to as our “quality of life”. The really important thing, to which my son’s allergy specialist eluded, is to understand those risks as best you can so that you can manage them to achieve the best possible outcome (i.e. the best possible quality of life), fortified with the knowledge and skill to handle an emergency. Investing is no different.
References
Constantinides, G 1979. A note on the suboptimality of dollar-cost averaging as an investment policy. Journal of Financial and Quantitative Analysis 14: 443-450.
Doren, B, Drew, ME, Walk, AN 2012. The retirement risk zone: a baseline study. Griffith Business School Discussion Papers: Finance, No. 2012-07.
Dunham, LM, Friesen, GC 2012. Building a better mousetrap: enhanced dollar-cost averaging. The Journal of Wealth Management 15: 41-50
Richardson, GM, Bagamery, BD 2011. Dynamic dollar-cost averaging. Journal of Financial Service Professionals, March 2011: 56-60.
Shiller, RJ 2000. Irrational Exuberance, Scribe Publications, Melbourne.
Shiller, RJ 2005. Irrational Exuberance, 2nd Edition. Doubleday, Sydney.
Williams, RE, Bacon, PW 1993. Lump sum beats dollar-cost averaging. Journal of Financial Planning, April 1993: 64-67.
© Copyright Brett Edgerton 2019

You must be logged in to post a comment.